If you're like a lot of investors, then you might be getting prepped to 'sell in May and go away' -- shedding stocks in anticipation of the historical market-wide weakness that kicks in during the middle of the year. And the math supports this assumption. Every month from May through September registers, on average, the poorest performances for the year, with a couple of them likely to dole out a loss.
But before you dump the bulk of your holdings -- especially your 'Forever Stocks' -- out of fear of what might happen to them during a summertime lull, it pays to take a closer look at the numbers behind this old axiom. As it turns out, investors may be better off just standing pat. Here's why...
Selling In May Makes Some Sense...
The 'Sell in May' premise actually has a superficial logic to it. The next five months are indeed poor performers. Since 1950, June and September have averaged -0.1% and -0.6% dips. August's results have generally been near breakeven levels. Even the two winning months have been tepid winners: May's average change is a mere 0.2% gain, and July -- the best in the bunch -- typically registers only a 1.0% return.
No wonder investors are encouraged to steer clear. But month-by-month averages alone just don't paint the whole picture.
...But the Logic Is Incomplete
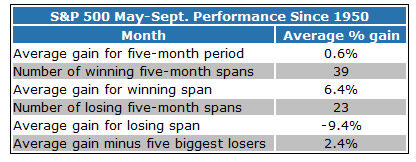
While it is true that every month between May and September is, on average, historically weak, it's not true that the average five-month span is weak. The average change for the S&P 500 between the end of April and the end of September is actually a 0.6% gain. In addition, it's still more likely that every one of those months will post a gain rather than a loss, except for September.

I know this average 0.6% move still isn't a move worth writing home about. But it's also not a move worth selling your core portfolio holdings over, and especially not your Forever Stocks (remember, these are the stocks that rain or shine -- you can feel confident holding practically 'forever.').
So how is it possible that each of the weakest five months of the year doesn't translate into a losing five-month span overall? It's simple. While we've seen some of the market's biggest declines materialize in the summertime months, it's a rarity to see big declines in back-to-back months in the same year.
Take 2010 as an example. The S&P 500 lost 8.2% in May of that year, adversely affecting May's average results. Things got worse in June, as the market fell another 5.4%. July was actually quite bullish that year though, with the S&P 500 rallying 6.9%. The bears struck again in August with a 4.7% blow, but the bulls countered the very next month with an 8.8% rebound for the S&P 500.
So while the market took some big hits in the middle months of 2010 and bearishly skewed the averages for May, June and August, it also bounced back just as firmly in the other summertime months. When it was all said and done, what felt like a bearish May-through-September span for 2010 was actually only a 3.8% decline.
An Even Better Logic
If the argument against the 'Sell in May' adage isn't strong enough, then here's another one -- a few statistical outliers have made the five-month period seem much weaker than it generally is. Or said another way, a few bad apples have spoiled the whole bushel.
In the past 62 years, the S&P 500 has actually made gains 39 times between May and September, and only lost ground 23 times. So, right off the bat, the odds of some kind of bullish progress during the summer are about 63%.

And it gets even better. If you remove the five worst May-through-September losses since 1950, then the average gain actually rises to 2.4%. And it's worth adding that all five of those big losers were black swan events like 9/11, 2008's financial crisis and last year's debt-ceiling and credit downgrade crisis -- the kinds of events that aren't actually calendar-based, nor systemic to the stock market.
Of course, there's always the chance that next year turns out to be one of the years that will prove the theory true enough to continue touting it. And then there's always the possibility of another black swan-type event -- but that could happen any other time of the year as well....
The Investing Answer: Yes, holding your solid positions through a lull may feel like watching paint dry, but there are a couple of upsides for those willing to wait it out. One of them is the possibility of delaying a stock-sale until a short-term gain becomes a long-term gain, thus incurring a lower tax liability.
The other upside is a chance of actually making bullish progress with the stocks you were considering selling. As noted, a 0.6% advance or even a 2.4% advance isn't a heroic move, but it's better than losing ground. Besides, there's no guarantee you'll find anything better to do with that money anyway. If you've done your homework and bought stocks for the long haul, then the overall numbers say you may as well stick with what you've got


