What is Williams %R?
Often combined with stochastics to detect overbought and oversold conditions, Williams %R -- or %R for short -- is a momentum indicator developed by Larry Williams.
How Does Williams %R Work?
While stochastics compares the close of a security/index to its lowest low over a specific time period, Williams %R compares the close to its highest high over a specified period.
Usually this time period is in increments of 14, as in 14 days, weeks, or months. However, the period can change depending on the sensitivity of the timeframe you want to trade.
Based on a 14-increment period, the calculation of Williams %R is:
(highest high over 14 periods - close)/(highest high over 14 periods - lowest low over 14 periods) *-100
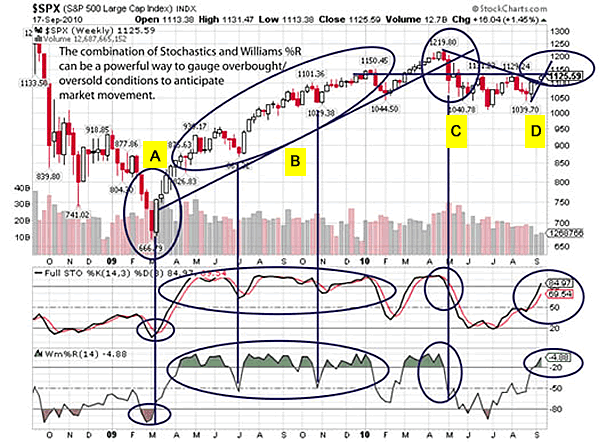
An analysis of the weekly S&P 500 chart provides a good example of how stochastics and Williams %R can be used in combination to anticipate market movement.

In March 2009 (labeled A), the S&P hit a low of 666.79. At this time, stochastics bottomed, with both %K and %D falling below 20. Williams %R was also deeply oversold, dropping below -80.
Note how shortly after the index bottomed stochastics gave a significant sell signal as %K crossed above %D, then rose above 20. Traders who observed this activity were tipped off to a strong buying opportunity.
But look how far in advance Williams %R anticipated the buying opportunity. The indicator peaked, forming a triangle-like shape in late February. By early March, it was climbing back into neutral territory. Traders who paid attention to this early warning sign could have identified and perhaps gingerly taken a long position before the market reversed.
From April 2009 to January 2010 (labeled B), both stochastics and Williams %R showed the S&P was, in general, highly overbought. Nonetheless, the S&P continued to rise steadily.
In July and late October 2009, Williams %R approached, but did not decisively break the key 50 juncture. Each dip was highly correlated with the S&P's low. Note, again, how %R anticipated these dips much in advance of stochastics.
By April 2010, the S&P had once again become highly overbought, as shown by both stochastics and Williams %R (labeled C).
Coming off its April 26 high of 1219.80, the index quickly plummeted to a low of 1040.78. However, traders who looked at stochastics in combination with Williams %R received early warning a top had been put in.
Stochastics then gave a significant sell sign as it dropped from highly overbought levels. Williams %R confirmed this signal. It peaked and dropped below 50 as the index fell.
During the September 6 trading week (labeled D), the intermediate downtrend line off the April 26 high was broken. It would appear the S&P is now in minor uptrend, challenging resistance between 1120-1130.
Stochastics appears bullish; it is not yet overbought at this point, but is above 50 on a buy signal. However, because neither %K nor %D is above 80, the buy signal is not significant.
Williams %R paints a slightly different picture. It shows the index is highly overbought, since it is above -20. It also looks as if it is beginning to form a peak, or triangle, at its current overbought level.
However, as we saw during the mid-2009 rally, multiple peaks can form in overbought territory while the index continues to climb higher. A significant sell signal, therefore, would only be given if Williams %R peaked, then dropped below -20 and continued falling below the key 50 juncture. This signal would likely occur on the break of the minor uptrend line and would likely also be captured by stochastics.
Why Does Williams %R Matter?
Using stochastics in combination with %R is a valuable way to confirm overbought or oversold conditions in order to help guide successful trading activity.
With increased buying pressure, a strong security can become and stay overbought for long periods. Likewise, with increased selling pressure, a weak stock/index can become and stay oversold for long periods. Therefore, stochastics is best examined in conjunction with bullish or bearish divergence, which shows momentum changing direction before price.
In contrast, Williams %R alone often accurately anticipates price reversal in and of itself. The indicator tends to form a triangle-like peak, then almost immediately reverses course. Price reversal tends to follow very shortly after.
Because full stochastics uses a smoothed moving average, the indicator tends to anticipate changes more slowly than Williams %R, which often gives a quicker signal.
Williams %R tends to be more responsive to overbought/oversold conditions. However, because it gives more frequent signals it can be less reliable than stochastics. Combining the two indicators can help create a more reliable analysis.
Observing Williams %R or stochastics in relation to overbought or oversold levels can help determine when to best enter or exit a trade. When the two indicators are used in combination, the analysis can be that much more powerful.


