What is a Long-Legged Doji Candlestick?
Long-legged doji candlesticks are one of four types of dojis -- common, long-legged, dragonfly and gravestone. All dojis are marked by the fact that prices opened and closed at the same level. If prices close very close to the same level (so that no or a very small real body is visible), then that candle is read as a doji.
How Does a Long-Legged Doji Candlestick Work?
After a long uptrend, the appearance of a doji can be an ominous warning sign that the trend has peaked or is close to peaking. A doji represents an equilibrium between supply and demand -- a tug of war that neither the bulls nor bears are winning. In the case of an uptrend, the bulls have by definition won previous battles since prices have moved higher. Now, the outcome of the latest skirmish is in doubt. Meanwhile, after a long downtrend, the opposite is true. The bears have been victorious in previous battles, forcing prices down. Now the bulls have found courage to buy and the tide may be ready to turn.
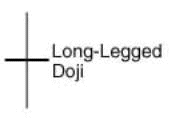
A 'long-legged' doji is a far more dramatic candle than the common doji. It says that prices moved far higher on the day or week of the candle, but then profit taking kicked in. Typically, a very large upper shadow is left. At the same time, the bulls saw lower prices as a buying opportunity and thus the long lower shadow. Traders should observe the candle's close in relation to the midpoint. A close below the midpoint of the candle shows weakness. Here's an example of a long-legged doji:

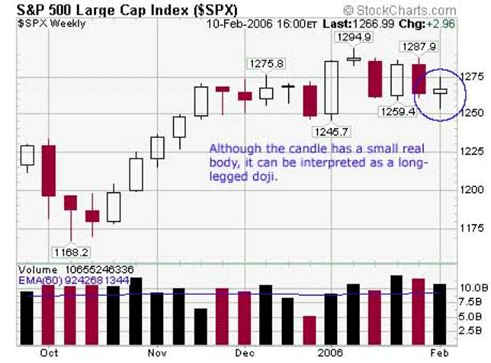
An illustration of the long-legged doji on the S&P chart is below. The candle should be read as a long-legged doji despite the small real body.

Why Does a Long-Legged Doji Candlestick Matter?
Traders should always note doji candles. The period, be it a week or day, immediately after the doji is particularly important. The doji says the market is at equilibrium. The subsequent candle declares who won the battle: the bulls or the bears.


