What is the Laffer Curve?
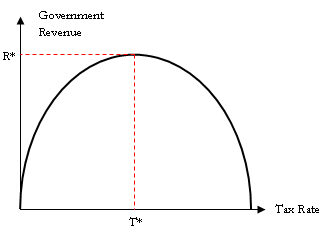
The Laffer curve is a graphic representation of the relationship between an increasing tax rate and a government's total revenues. The relationship suggests that revenues decline beyond a peak tax rate.
How does the Laffer Curve work?
Named for its creator, economist Arthur Laffer, the Laffer curve has a parabolic shape plotted on a graph: Government revenue is displayed on the vertical axis, and the tax rate appears on the horizontal axis.

The shape of the Laffer curve suggests that government revenues diminish with tax rate increases beyond an optimal level denoted as T*. This is based on the theory that beyond a certain tax rate, a country's taxpayers will have a decreasing incentive to work knowing that more and more of their money is being taken by the government. In other words, according to this model, at tax rates approaching 100%, taxpayers will work little, if at all.
Why does the Laffer Curve matter?
According to the Laffer curve, a government that wishes to maximize tax revenues must determine its optimal tax rate. Many economists have indicated that this can only be estimated for practical purposes.


