What is the J-Curve Effect?
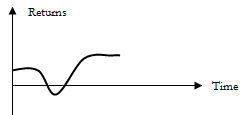
The J-curve effect refers to a 'J' shaped section of a time-series graph in which the curve falls into negative territory and then gradually rises to a higher level than before the decline.
How Does the J-Curve Effect Work?
The J-curve effect is a phenomenon in which a period of negative or unfavorable returns is followed by a gradual recovery that stabilizes at a higher level than before the decline. The progression of this phenomenon appears as a 'J' shape on a time-series graph.

The J-curve effect is often seen in a country's balance of trade and equity fund returns.
A country's trade balance experiences the J-curve effect if its currency becomes devalued. At first, the country's total value of imports (goods purchased from abroad) exceeds its total value of exports (goods sold abroad), resulting in a trade deficit. But eventually, the currency devaluation reduces the price of its exports. Consequently, the country's level of exports gradually recovers, and the country moves back to a trade surplus.
Equity fund returns typically experience the J-curve effect in the first years following their formation. Initially, equity funds yield negative annual returns resulting from start-up costs and high management fees. However, once a fund stabilizes, its value gradually rises into positive territory and beyond its initial value.
Why Does the J-Curve Effect Matter?
Economic analysts and policymakers may factor the J-curve effect into their analyses and decisions as a way to gauge both short- and long-term effects of a variable change (for example, a decline in exchange rates) or new policy.


