Investors have a wide variety of tools and tactics to help extract profits from the markets. The majority of these tools boil down to two distinct categories: fundamental analysis and technical analysis.
There is fundamental analysis, in which the balance sheet, earnings reports, news and other factors are scrutinized to determine the financial strength of a company. There is also technical analysis, which studies past price and volume history in an effort to find repeating patterns. It is also used to gauge the strength of a price trend, whether or not a move is overextended, and a host of other metrics.
Hard-core technical analysts believe that all fundamental data is already inherent within the stock's price and trading volume. Therefore, only price and volume are needed to make proper investing decisions. However, this is an extreme view. Wise investors should use both technical and fundamental analysis when making investing decisions.
My favorite way to use technical analysis is as a tool to determine if price is overextended one way or the other. The easiest technical indicator to use for this purpose is this: Bollinger Bands ®.
What Are Bollinger Bands?
Bollinger Bands were created and popularized by John Bollinger in the early 1980s as a way to measure volatility. Bollinger Bands are built upon the 'trading bands' concept, introduced by early technical analysis researcher J.M. Hurst and refined by Marc Chaikin.
Put simply, trading bands are moving averages that envelop price bars on a chart. Standard Bollinger Bands consist of a 20-period simple moving average, an upper band two deviations above the moving average and a lower band two deviations below.

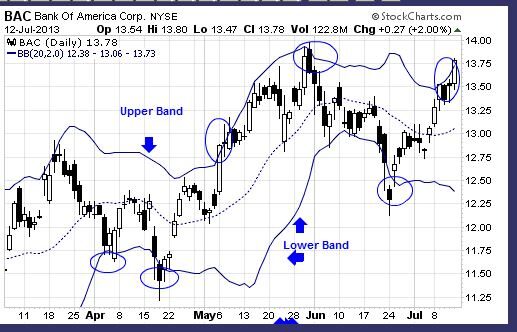
In this example involving Bank of America's (NYSE:BAC) stock, note how each time price hits or pierces the lower line, it soon bounces higher. According to the Bollinger Bands, this chart would be signaling 'buy.'
How To Use Bollinger Bands
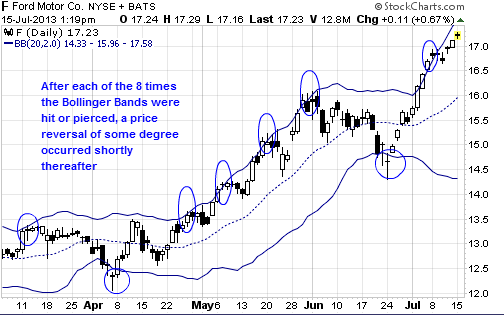
Bollinger Bands provide a visual picture to determine whether a security's price is overextended relative to the 20-period simple moving average. It can be determined whether price is overextended one way or another if the price bar breaks through the upper or lower band. The idea is either to short a stock if the upper line is hit or pierced -- with the assumption that price will soon drop back to the mean (the middle line) -- or to buy if the lower line gets hit or pierced while awaiting the reversion to the mean.

It is important to keep in mind that price can ride the upper or lower band for longer than you might expect prior to reverting to the mean. Therefore, Bollinger Bands shouldn’t be used alone as a 'buy' or 'sell' signal but as a confirmation tool for other indicators.
For example, if the price bar pierces the upper line but your other indicator does not confirm the bullish signal, this is a 'sell' trigger. If the indicator does confirm and you are already in the trade, this is a sign to hold.
The Investing Answer: Take a look at your portfolio holdings through the lens of Bollinger Bands to determine if price is overextended in one direction or another. If you discover this is the case, dig a little deeper into the fundamentals and news about the company. If what you find confirms that price has moved too far in either direction, it may be a sign to add to the position or to start to take profits.
Remember, this is one of the simplest ways to use Bollinger Bands. There are multiple other ways to use the bands. Here is a good place to begin further research.


